
This is the fourth lesson from the Arduino IoT Cloud manual. Have you not yet taken the first lessons? Check this out HERE. In this lesson you will learn how to read the value of an HC-SR04 ultrasonic distance sensor in the Arduino IoT. We store these values so that we can see them in a graph.
- Level - Beginner 20%
- Duration - 15 / 25Min 25%
- Costs - € 34,05 complete 25%
Step 1: Requirements
1X Arduino Nano 33 IoT
1X breadboard
4X jumper wires
1X HC-SR04
1X Breadboard nutrition. (5V)
Arduino Build
Step 2: Setup Arduino Create
For the project we create a new “Thing”. You can also use one of the “Thing” s from the previous lessons. But to keep everything clear, we are creating a new “Thing” for this project. In this project we have called the ”Thing” Arduino-IoT-Lesson-4-Distance-Sensor. When the thing is created we add a property. The property in this case is a Distance sensor. For type we again go for ”Length (centimeters)”. We only want to read data, so the permission must be set to read only. At the bottom of the page you will see History. We select this to store the incoming data. This allows us to later see a graph with the measured values.
Now that we have made the property we are going to build and wire it.

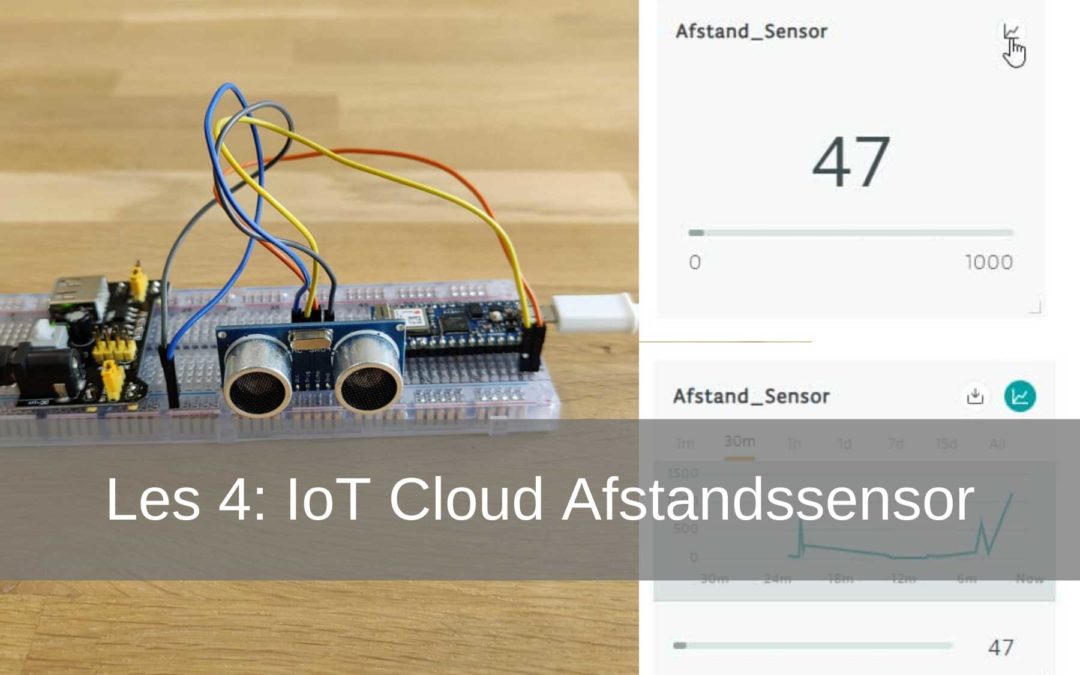
In the image below you can already see some data. You will only see this once the code has been uploaded. The current distance is shown in the left image. At the top right you see a small graph. If you click on this you will see the right image. The collected data is converted into a graph. You can see the last minute, 30 minutes, hour, etc.


Step 2: Building and Wiring
Now we are going to put the project together.
You start by placing the Arduino Nano 33 IoT on the breadboard† In the middle of the breadboard there is a slot. Make sure the pins of the board on both sides of the slot as shown below. The HC-SR04 requires a 5V power supply. To supply the sensor with constant voltage, we use a Breadboard nutrition. The HC-SR04 has 4 pins. The VCC connects to the + path of the breadboard because it now has 5V on it. Next we connect the Trig (trigger) pin to D11. We connect the Echo pin to D12 and the GND pin to the – path of the breadboard.
NB! If you like the Breadboard power supply used make sure the jumper cap is set to 5V instead of 3,3V.
Now that you have finished building and wiring the circuit, you can start programming.

Step 3: Programming

We program the Arduino in the same way as in the previous lessons. The code you will use for this is below. If you want to learn it better, type the code instead of copying and pasting it. You will learn to program better.
Once you have written the code you can upload it to the Arduino. If this is successful, go back to the IoT Cloud, click on dashboard† You should now see data as shown in the images in step 1.
#define ULTRASONIC_TRIG_PIN 11 // pin TRIG is D11
#define ULTRASONIC_ECHO_PIN 12 //pin ECHO is D12
#include "thingProperties.h"
void setup () {
Serial.begin (9600);
delay (1500);
initProperties ();
ArduinoCloud.begin (ArduinoIoTPreferredConnection);
setDebugMessageLevel (2);
ArduinoCloud.printDebugInfo ();
pinMode (ULTRASONIC_TRIG_PIN, OUTPUT); // The trigger is defined as output
pinMode (ULTRASONIC_ECHO_PIN, INPUT); // The Echo is defined as input
}
void loop () {
ArduinoCloud.update ();
long duration, Distance_Sensor;
digitalWrite (ULTRASONIC_TRIG_PIN, LOW);
delayMicroseconds (2);
digitalWrite (ULTRASONIC_TRIG_PIN, HIGH); // With this we send an ultrasonic sound
delayMicroseconds (10); // We will send for 10 milliseconds
digitalWrite (ULTRASONIC_TRIG_PIN, LOW); // Now we stop transmitting
duration = pulseIn (ULTRASONIC_ECHO_PIN, HIGH); // Here we measure how long it takes before we get the ultrasound back.
distance_Sensor = (duration / 2) / 29.1; // With this we ensure that the values in cm are displayed in the IoT cloud
Serial.print (”Distance:“); // To be able to check whether everything is working without an IoT Cloud connection, we also display it in the Monitor
Serial.print (distance_Sensor);
Serial.println ("cm");
}
Now you know how to read data from a sensor and display it in a graph.